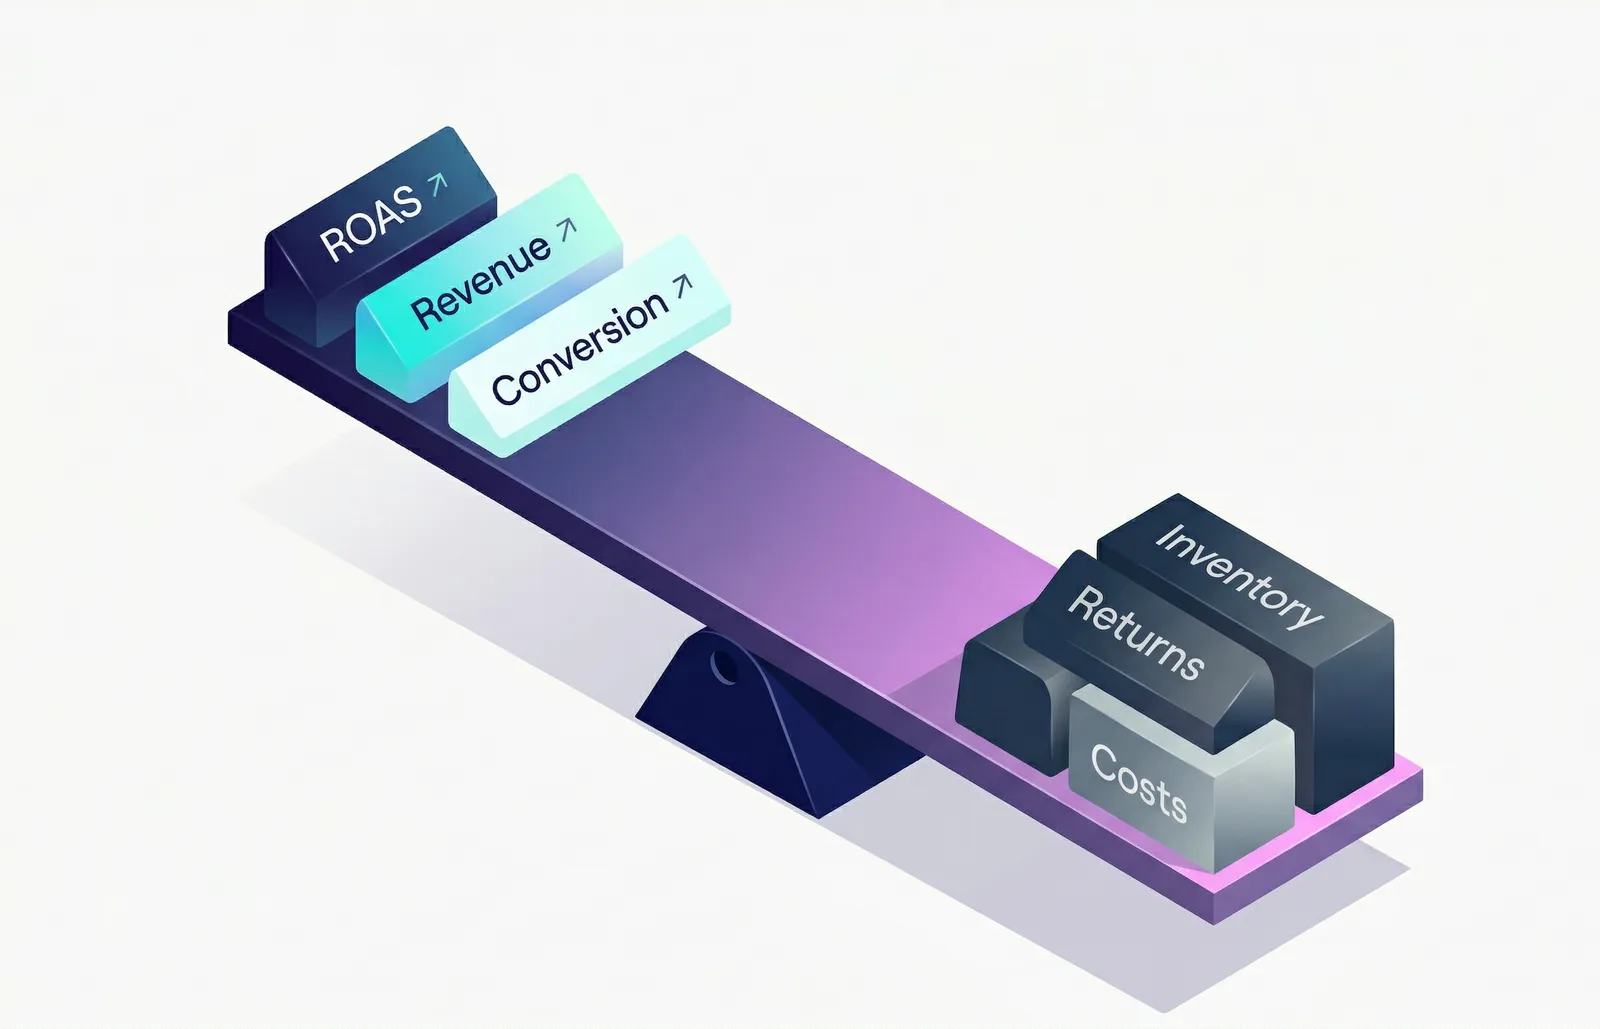
When I discuss Agenie with ecommerce teams and executives, a consistent blind spot emerges more often than not.
The conversation almost always starts the same way. A dashboard appears and the discussion turns to ROAS, revenue growth, conversion rate and CAC. The marketing metrics are front and centre. Clearly tracked. Clearly understood.
Then I ask about the economics behind them. What is the effective margin after returns and fulfilment? How does inventory turnover look by category? How much cash is tied up in stock right now?
Many ecommerce businesses consider themselves data-driven. In practice, most of the instrumentation sits around marketing.
More often than not it takes a while to get an answer. Not because the data does not exist. It does. But because nobody is looking at it in the same place at the same time. It is spread across systems: operations tools, finance systems and usually a spreadsheet someone built months ago.
Marketing metrics are immediate and actionable. The costs that actually determine whether the business is profitable are slower to surface, harder to read in real time and sitting in different systems.
The result is that a business can look healthy on a marketing dashboard while its underlying economics are quietly deteriorating.
That gap, and the damage it quietly causes, is what this post is about.
The Metrics That Get Attention Are the Ones Easiest to See
Advertising platforms are built around real-time performance reporting. Meta, Google and TikTok give ecommerce teams visibility into impressions, clicks and cost per acquisition within minutes of a campaign going live. Entire ecosystems of analytics tools now exist to consolidate these marketing signals into a single dashboard.
So that is where attention goes.
Some of this is about tools. But some of it is cultural. Many ecommerce leaders built their careers in marketing. ROAS, CAC and conversion rate are fluent second languages. Inventory turnover, fulfilled margin or cash conversion cycle often are not.
There is also something most people will not say out loud: marketing is simply more interesting to talk about. Launching campaigns, scaling winning channels and testing creative feels like growth. Rationalising slow-moving SKUs or improving sell-through rarely generates the same energy in a meeting.
It is understandable. But it has consequences.
Marketing spend is also one of the few truly explicit costs in an ecommerce business. Every pound spent on acquisition appears clearly in dashboards and financial reports.
Many of the costs that determine whether the business is actually profitable behave differently. Returns processing, fulfilment inefficiency, discounting that erodes margin and inventory tied up in slow-moving SKUs emerge gradually across operational systems that rarely talk to each other.
Visibility creates focus. The problem is when visibility becomes a substitute for understanding what is actually making or breaking the business.
Strong Revenue Growth Does Not Mean Healthy Economics
The pattern is not theoretical. The last decade produced many brands that grew quickly without building a sustainable business underneath the revenue.
Mattress company Casper grew rapidly on the back of heavy digital advertising but struggled to translate growth into sustainable profitability.
Meal-kit pioneer Blue Apron surpassed $1 billion in revenue before the economics of customer acquisition and fulfilment caught up with the model.
In the UK, fashion brand In The Style went from a £105 million valuation at IPO to a £1.2 million sale just two years later.
In each case the marketing metrics initially looked strong. The underlying economics told a different story.
Different categories. Same pattern.
Strong marketing metrics can coexist with weak business economics for years before the gap becomes visible.
Example 1: Strong Marketing Numbers, Weak Return Economics
Consider a DTC brand generating $30 million in GMV with an average order value of $100, roughly 300,000 orders per year. If the business runs at 2x ROAS it is spending approximately $15 million on advertising to generate that revenue.
On paper:
$15M ad spend
$30M revenue
ROAS: 2.0x
The marketing team is hitting their number.
Now introduce a 20 percent return rate, which is common in apparel. That is $6 million of revenue that will eventually reverse. Realised revenue drops to $24 million. Effective ROAS falls from 2.0x to roughly 1.6x.
Returns also carry operational costs. Processing 60,000 returned orders at roughly $15 each adds another $900,000 in expense.
Nothing about this scenario is unusual. The marketing team may have executed well. But the profitability picture looks completely different once you include what happens after the sale.
Example 2: Healthy Revenue, Cash Quietly Disappearing
Take the same $30 million business. A COGS of $40 per order implies $12 million in annual cost of goods sold. At four inventory turns per year the company needs roughly $3 million of stock on hand.
Now suppose demand becomes uneven across the product range and inventory turnover slows to two turns per year.
Revenue still reads $30 million. Marketing dashboards still look healthy.
But the business now requires $6 million of stock to support the same level of sales. An additional $3 million of cash is quietly locked up in inventory with no increase in revenue.
Revenue growth looks fine. The cash position tells a different story.
The Silo and Timeframe Problem
Each part of the business tracks its own numbers.
Marketing monitors acquisition performance.
Operations tracks fulfilment, returns and inventory.
Finance measures margins and cash flow.
Each team sees its own data clearly. What is rarely visible is how those numbers connect.
That disconnect is where many profitable-looking businesses begin to break.
The problem is compounded by time. Marketing performance is evaluated daily or hourly. Operational effects emerge weeks later. Financial consequences appear even later when accounts close.
When the cause sits in one system and the effect appears in another weeks later it becomes extremely difficult to connect the two.
Most companies bridge the gap manually: exporting data, reconciling spreadsheets and trying to assemble a coherent picture of performance.
That spreadsheet is often the closest thing leadership has to an integrated view of the business.
Marketing Metrics Are Non-Negotiable. They Are Not the Whole Scorecard.
Marketing metrics are non-negotiable. If you cannot acquire customers at a viable cost nothing else matters.
But they are also the easiest way to misunderstand the health of the business if they become the entire scorecard.
The brands mentioned earlier did not fail because they were bad at marketing. They grew quickly and built strong brand recognition.
They struggled because marketing metrics became the lens through which performance was judged while margin, operational cost and cash pressure built underneath.
From the dashboard everything looked like it was working.
In most cases this is not a failure of marketing skill or individual judgment. It is often an organisational problem — the data exists but sits in separate systems owned by separate teams, each focused on their own function. Sometimes it is a technology constraint. Either way, the gap between what the dashboard shows and what is actually happening in the business persists, and it tends to compound quietly over time.
What Comes Next
The next post in this series explores which metrics actually reveal whether a DTC business is getting stronger.
It introduces a three-tier framework:
Tier 1: Business health outcomes: contribution margin, EBITDA and free cash flow.
Tier 2: Functional drivers: CAC, return rate, inventory turnover, AOV and conversion rate.
Tier 3: Leading indicators: CPM trends, add-to-cart rate, NPS and refund requests.
It also explores which metrics matter most as businesses scale from £1M to £50M and beyond.
If this post identifies the problem, the next one is the operating framework.
Key Takeaways
Marketing metrics dominate ecommerce discussions because they are the most visible and easiest to act on — not because they are the most important.
Strong revenue growth does not mean the business is actually getting healthier.
Return rates can significantly reduce effective marketing performance once realised revenue is considered.
Slowing inventory turnover can lock up millions in cash while revenue appears healthy.
Marketing, operations, and finance run on different clocks — which makes it genuinely hard to connect cause and effect across functions.
The businesses that manage this well track the right metrics together — not more metrics in more silos.
Frequently Asked Questions
Q: Why do ecommerce companies focus so heavily on marketing metrics?
A: Because marketing metrics are updated in real time through advertising platforms and are directly tied to spending decisions teams make daily. Other operational costs such as returns, inventory and fulfilment are harder to see in real time and sit in separate systems that rarely connect.
Q: Can strong revenue growth hide economic problems?
A: Yes. Revenue can grow while profitability weakens if return rates increase, inventory turnover slows, or acquisition costs rise faster than lifetime value. Blue Apron, Casper, and In The Style all demonstrated versions of this pattern at scale.
Q: What is the relationship between return rate and ROAS?
A: Returns reduce the revenue actually realised from a campaign. A 20% return rate on a campaign running at 2.0x ROAS reduces effective ROAS to approximately 1.6x, before accounting for the cost of processing each return.
Q: Why does inventory turnover matter to a growing ecommerce business?
A: Inventory turnover determines how much cash is tied up in stock. A business that halves its inventory turns from four to two on the same revenue base doubles the capital required to support operations, with no increase in sales.
Q: What ecommerce profitability metrics should ecommerce businesses track beyond marketing KPIs?
A: The next post in this series covers this with a full three-tier framework. In brief: Tier 1 is business health outcomes, such as contribution margin, EBITDA, and free cash flow. Tier 2 is the functional drivers that explain why those outcomes move (CAC, return rate, inventory turnover, AOV, and conversion rate). Tier 3 is the leading indicators that predict where things are heading before outcomes shift (CPM and CPC trends, add-to-cart rate, NPS, and refund request rate). The framework also distinguishes which metrics carry the most weight at different stages of growth.
Q: Why is it difficult to connect marketing and operational metrics?
A: Marketing, operations, and finance typically track performance in different systems on different schedules. A campaign's downstream effects on returns and inventory may not surface for weeks, by which point the connection to the original decision has been lost.
Know where to act next
Agenie connects your stack and turns your metrics into decisions. Live in minutes, no SQL required.
No credit card required · Or book a demo