It is revenue minus cost of goods sold. That is gross margin. It answers one question: after you pay for the product, what is left?
It does not subtract what you spent on Meta and Google to get the customer to your site. It does not subtract what you paid to ship the order, process the payment, or handle the return. For most DTC brands, the gap between gross margin and actual margin is 25 to 45 percentage points. A brand showing 65% gross margin might be running at 18% once everything is counted. Or 10%. Or negative.
This is not a Shopify problem. Shopify reports what Shopify owns. Your ad platforms, 3PL, payment processor, and returns tool each hold a piece of the cost picture, and none of them talk to each other. Facebook and Google specifically do not share cost metrics back into Shopify's reporting. So the profit number you see on your Shopify home screen is missing the biggest variable cost in your business: what you spent to acquire the customer.
The metric that closes this gap is Contribution Margin 3. CM3. It is the single most honest number for answering: when I sell a product and pay to acquire the customer, did I actually make money?
The contribution margin stack
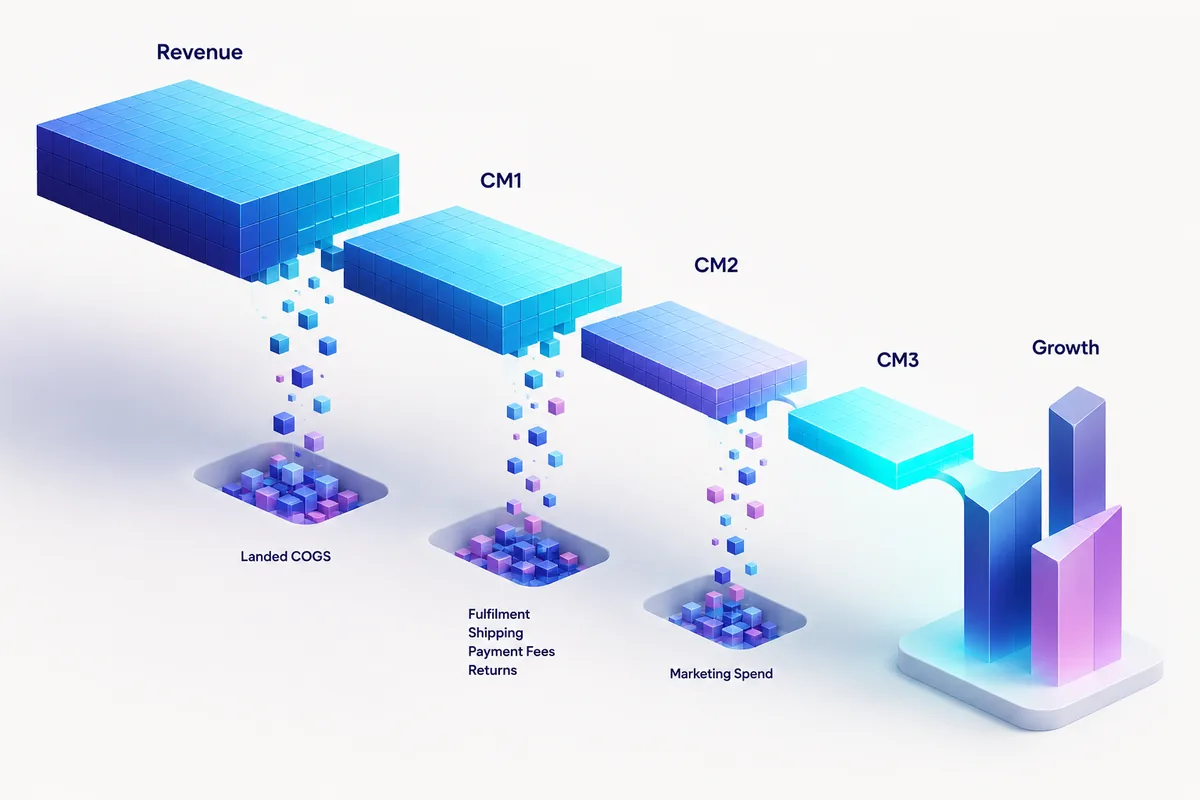
Contribution margin is not one number. It is a stack, and each layer strips out a different category of cost.
CM1: did the product make money?
Net revenue minus landed cost of goods sold. Landed COGS means the full cost of getting the product to your warehouse: manufacturing, inbound freight, duties, tariffs. Not the catalogue cost you typed into Shopify, which typically understates the real number by 5 to 10 points.
If CM1 is below 50%, your product economics are tight. Below 40%, everything downstream gets painful.
CM2: did the order make money?
CM1 minus the cost of fulfilling the order and processing the transaction. Pick, pack, and ship from your 3PL. Outbound shipping. Packaging. Payment processing fees (typically 2.9% plus a fixed fee). Returns processing on units that come back.
CM2 tells you whether each order is profitable before you account for customer acquisition. It is the right lens for product mix decisions, pricing reviews, and identifying SKUs that quietly lose money on every sale.
For most physical goods DTC brands, healthy CM2 sits between 35% and 55%. Apparel tends lower because return rates are higher. Beauty and supplements tend higher because fulfilment is lighter and returns are less frequent.
CM3: did the business make money?
CM2 minus variable marketing spend. Paid ads across all channels. Affiliate commissions. Influencer fees tied to transactions. Any cost that scales with customer acquisition.
This is where the truth lives. A brand can show strong gross margin, acceptable CM2, and negative CM3. That means every pound spent to grow actively loses money. Revenue goes up. Cash goes down. The dashboard looks green. The bank account says otherwise.
The formula:
CM3 = Net Revenue - Landed COGS - Fulfilment Costs - Payment Fees - Returns Costs - Marketing Spend
Or: CM3 = CM2 - Variable Marketing Spend.
A worked example
Take a DTC apparel brand selling a £65 item.
CM1:
Landed COGS is £19.50 (30% of retail), including manufacturing, inbound freight, and duties.
CM1 = £65.00 - £19.50 = £45.50 (70%)
Looks healthy. This is roughly what Shopify would show you.
CM2:
Fulfilment (pick, pack, ship): £4.20. Outbound shipping: £3.80. Packaging: £0.90. Payment processing (2.9% + £0.20): £2.09. Returns cost, spread across all orders at a 22% return rate with £9 processing cost per return: £1.98.
Total variable order costs: £12.97.
CM2 = £45.50 - £12.97 = £32.53 (50%)
Margin just dropped 20 points. The order is still profitable, but the picture already looks different from what Shopify showed.
CM3:
The brand spends £22,000 per month on paid ads and acquires 1,100 customers. Blended CAC: £20.00. Plus affiliate commissions averaging £1.50 per acquired order.
Total marketing cost per order: £21.50.
CM3 = £32.53 - £21.50 = £11.03 (17%)
From 70% gross margin to 17% real margin. That 53-point gap is where most DTC brands lose visibility. They see the 70%. They plan around the 70%. They scale to the 70%. And they wonder why cash keeps getting tighter.
At 17%, this brand is profitable. But barely. One bad month of rising CPMs, a seasonal return spike, or a 15% promotion, and CM3 goes negative.
What good CM3 looks like
EcomCFO's 2026 Annual Benchmark Report, built from actual P&L data across their DTC client base, found that EBITDA of 20% or higher puts you in the 95th percentile of your revenue cohort. For context, the average brand in the £10M to £50M range had EBITDA of roughly 5% in 2024. That tells you how thin the margins are in this industry before you even isolate CM3.
Category-level benchmarks give you a more useful target:
Beauty and skincare: 18% to 28% CM3. Higher gross margins (60% to 70%) and low return rates (under 10%) create room. The constraint is usually acquisition cost, which keeps climbing as the category gets more crowded.
Apparel and fashion: 10% to 22% CM3. Gross margins are solid (50% to 65%) but return rates (15% to 30%) compress the operational layer hard. Brands that solve sizing can lift CM3 by 5 to 8 points without changing anything else in the business.
Food, beverage, and supplements: 4% to 14% CM3. Lower gross margins (35% to 50%) compress the stack from the start. The path to healthy CM3 in this category runs through subscription and retention, not acquisition efficiency.
Best in class across categories: 25% to 30%+. These brands typically have either premium pricing with strong margins, high repeat purchase rates that pull blended CAC down, or both.
Minimum viable: 15%. Below this, the business has no buffer against normal volatility. A CPM spike, a bad product batch, a promotional period. Any of those can push CM3 negative. At 15%, scaling is a bet. At 20%+, scaling is a decision you make with confidence.
Why most brands do not track CM3
The data lives in different places.
COGS is in Shopify (if you entered it correctly). Fulfilment costs are in your 3PL portal. Payment fees are in Stripe or your processor. Return costs are in your returns tool. Marketing spend is split across Google Ads, Meta, TikTok, and whoever else you are paying.
No single system has all the inputs. So most operators calculate gross margin (because Shopify shows them that) and check platform ROAS (because Meta and Google show them that) and assume the gap in between is fine.
The gap in between is where the margin lives or dies.
The EcomCFO benchmark data makes this point clearly. They found that ROAS declined roughly 9% year on year for brands above £10M in revenue. But the brands under £10M actually improved ROAS by 17%. The catch? Some of that improvement likely came from shifting costs into fixed marketing spend below the contribution margin line, not from genuine efficiency gains. The brands that only watched ROAS would have thought things were getting better. CM3 would have told a different story.
The brands that do track CM3 usually do it one of two ways. They build a spreadsheet that pulls from five platforms, updated weekly by someone who logs into each one, downloads the data, normalises the formats, and runs the calculation manually. It works until it stops working. It lags. It breaks when someone forgets a tab. And it is always at least a week behind the decisions it should be informing.
The second way is to connect the sources directly so the calculation is live. That is what Agenie does. Your Shopify, Google Ads, and Meta data feed into one system, and CM3 is calculated automatically alongside MER, blended CAC, and every other metric that depends on cross-platform data.
Five mistakes that compress CM3
1. Using catalogue COGS instead of landed COGS
The cost you entered in Shopify when you created the product is almost never the real cost. It usually excludes inbound freight, duties, and tariffs. For brands importing from overseas, the gap between catalogue and landed cost can be 8 to 15 percentage points. Every number downstream inherits that error.
2. Ignoring returns in your cost stack
A brand with a 25% return rate is not just losing 25% of revenue on those orders. Each return carries a processing cost of £6 to £12. Spread across all orders, returns add £1.50 to £3.00 per order in hidden cost. Brands that exclude returns from their CM2 calculation overstate margin on every single sale.
3. Treating marketing spend as a fixed cost
If your ad spend scales with revenue, it is a variable cost and belongs in CM3. Some brands classify marketing as overhead and exclude it from contribution margin entirely. This makes unit economics look better than they are. The test is simple: if you stopped spending, would you stop acquiring customers? If yes, it is variable.
4. Calculating CM3 per channel instead of blended
The moment you allocate marketing spend to individual channels and calculate per-channel CM3, you inherit all the noise from how each platform counts conversions. Platform-reported ROAS systematically overstates performance. Per-channel CM3 looks precise but is mostly fiction. Calculate CM3 blended. It is the only level at which the number is reliable.
5. Checking CM3 monthly instead of weekly
Monthly CM3 hides intra-month volatility. A strong first three weeks can mask a terrible final week where CPMs spiked and CM3 went negative. By the time the monthly number arrives, you have already spent through the problem. Weekly CM3 gives you the resolution to act before a bad week becomes a bad month.
How CM3 changes your decisions
When CM3 is visible and current, decisions get sharper.
Scaling spend. Before increasing your ad budget, look at CM3 at the current spend level. If CM3 is 12%, doubling spend will almost certainly push it negative because acquisition cost rises with scale. If CM3 is 25%, there is room to push.
Promotions. A 20% discount on a product with 17% CM3 makes every promoted order unprofitable. This sounds obvious, but most brands plan promotions against gross margin, not CM3. The discount looks fine at 70% gross margin. It is not fine at 17% CM3.
Product mix. Sort your catalogue by CM3 per SKU. The products with the highest gross margin are not always the ones with the highest CM3, because return rates, fulfilment costs, and marketing spend vary by product. A high-gross-margin product with a 30% return rate might generate less CM3 than a lower-margin product that nobody sends back.
Channel mix. If email drives 25% of revenue at near-zero marginal cost, shifting the mix toward retention channels and away from paid acquisition improves blended CM3 without touching product or pricing. This is the most common unlock for brands stuck below 15% CM3.
Knowing when to stop. CM3 is the metric that tells you whether growth is creating value or destroying it. If CM3 has been declining for three consecutive months while revenue grows, you are paying for growth with margin. That is not scaling. That is spending.
CM3 and MER: the pair that matters
MER (Marketing Efficiency Ratio) is total revenue divided by total marketing spend. It measures how efficiently you acquire revenue. CM3 measures how much you keep after all variable costs. They work together.
Rising MER with stable or rising CM3 means you are getting more revenue per pound of marketing spend and keeping more of it. That is healthy scaling.
Rising MER with declining CM3 means something else in the cost stack is moving. Fulfilment, returns, or COGS have increased enough to offset the marketing efficiency gain. MER alone would tell you things are improving. CM3 tells you they are not.
Declining MER with stable CM3 is a warning. You are spending more to acquire each pound of revenue, but other efficiencies are compensating. It works until they stop compensating.
Both numbers matter. Neither is sufficient alone. The operators who track both, and watch how they move relative to each other, make better decisions than those who track either in isolation.
Start here
If you have never calculated CM3, start with last month.
Pull your net revenue from Shopify. Subtract your landed COGS (not the catalogue cost, the real cost including freight and duties). Subtract your total fulfilment, shipping, and packaging costs. Subtract your payment processing fees. Subtract your returns processing costs. Subtract your total marketing spend across all channels.
What remains is CM3.
If the number is above 20%, you have a business that can scale with confidence. If it is between 10% and 20%, you have a business that works but has no margin for error. Below 10%, something in the cost stack needs to change before growth makes sense.
The number itself is the starting point. What changes decisions is tracking it weekly and watching the trend. A single CM3 snapshot tells you where you are. A CM3 trend tells you where you are heading.
If connecting the data to see CM3 live sounds like what you need, that is what we built Agenie for. Your Shopify, ad platforms, and operational data in one place, with CM3 and 300+ other governed metrics calculated automatically.
Georges
Key Takeaways
1. CM3 = Net Revenue - Landed COGS - Fulfilment Costs - Payment Fees - Returns Costs - Marketing Spend. It is the only metric that answers: after I paid for the product, fulfilled the order, and acquired the customer, did I actually make money?
2. The gap between gross margin and CM3 is typically 25 to 45 percentage points. A brand running at 65% gross margin can easily land at 17% CM3 once the full cost stack is counted.
3. Healthy CM3 varies by category. Beauty: 18% to 28%. Apparel: 10% to 22%. Food and supplements: 4% to 14%. Below 15% in any category means no buffer against normal cost volatility.
4. Most brands do not track CM3 because the data lives in five different systems. COGS in Shopify, fulfilment in the 3PL, payment fees in Stripe, returns in a returns tool, ad spend in Google and Meta. Nobody connected them.
5. Calculate CM3 weekly, not monthly. Monthly CM3 hides intra-month swings. Weekly gives you the resolution to act before a problem compounds.
6. CM3 tells you whether growth is creating value or destroying it. Revenue can grow while CM3 declines. That is not scaling. That is spending.
Frequently Asked Questions
Q: What is the difference between gross margin and CM3?
Gross margin is revenue minus COGS. CM3 subtracts everything else that varies with each order: fulfilment, shipping, packaging, payment processing, returns processing, and marketing spend. Gross margin tells you if the product is viable. CM3 tells you if the business is viable.
Q: How is CM3 different from EBITDA?
CM3 is a variable-cost metric. It only includes costs that scale with order volume and customer acquisition. EBITDA also includes fixed costs like rent, salaries, and software. CM3 tells you whether each incremental order contributes positively. EBITDA tells you whether the whole business, including overhead, is profitable. EcomCFO's benchmark data shows that 20%+ EBITDA puts you in the 95th percentile of DTC brands, which gives you a sense of how rare strong profitability is in this industry.
Q: Should I calculate CM3 per channel?
No. Calculate it blended. Per-channel CM3 requires allocating marketing spend to specific channels, which depends on how each platform counts conversions. Platform-reported data systematically overstates performance. Blended CM3 sidesteps this by dividing total marketing spend across total orders.
Q: What if I do not know my exact fulfilment costs per order?
Use your total monthly fulfilment invoice divided by orders shipped. It will not be exact per SKU, but it is accurate at the blended level. For more precision, break it down by weight class or product category if your 3PL provides itemised billing.
Q: What CM3 do I need to be profitable?
CM3 covers variable costs only. You still need it to cover your fixed costs (team, rent, software) and leave profit. Rough guide: if monthly fixed costs are £30,000 and you ship 3,000 orders, you need at least £10 CM3 per order just to break even. Anything above that is profit. If CM3 per order sits below fixed cost per order, more volume makes the problem worse, not better.
Q: How does CM3 relate to MER?
MER (Marketing Efficiency Ratio) is total revenue divided by total marketing spend. It measures acquisition efficiency. CM3 measures profitability after all variable costs. A rising MER with declining CM3 means you are acquiring more efficiently but losing margin elsewhere. Track both and watch how they move relative to each other.
Sources
EcomCFO, "2026 Annual Benchmark Report: Full-Year 2025 vs. 2024 Revenue, Margins and EBITDA by Cohort." Actual P&L data from DTC brands broken out by revenue cohort (under £10M, £10M to £50M, over £50M). Revenue growth, gross margin, ROAS, G&A, and EBITDA benchmarks. ecomcfo.co
Shopify Help Centre, "Understanding your profit reports." Documentation on what Shopify's built-in profit reporting includes and excludes. help.shopify.com
Know where to act next
Agenie connects your stack and turns your metrics into decisions. Live in minutes, no SQL required.
No credit card required · Or book a demo