In Part 1 of this series, I explained why small to mid-market ecommerce struggles with data-driven decision making: fragmented data across platforms, missing analytical talent, and the difficulty of combining data expertise with ecommerce domain knowledge.
In Part 2, I discussed why the obvious solutions fall short. Hiring analysts creates bottlenecks. BI platforms require technical expertise to operate effectively. Automation tools still require you to export data, construct workflows, and maintain them as the business evolves.
So what actually works?
Ecommerce analytics designed to operate as part of the business, not as a separate reporting layer. A system that absorbs the complexity of integration and domain logic, and delivers insight without requiring technical expertise to extract it.
That is the premise behind the Agenie platform.
What That Looks Like in Practice
The platform operates across three layers.
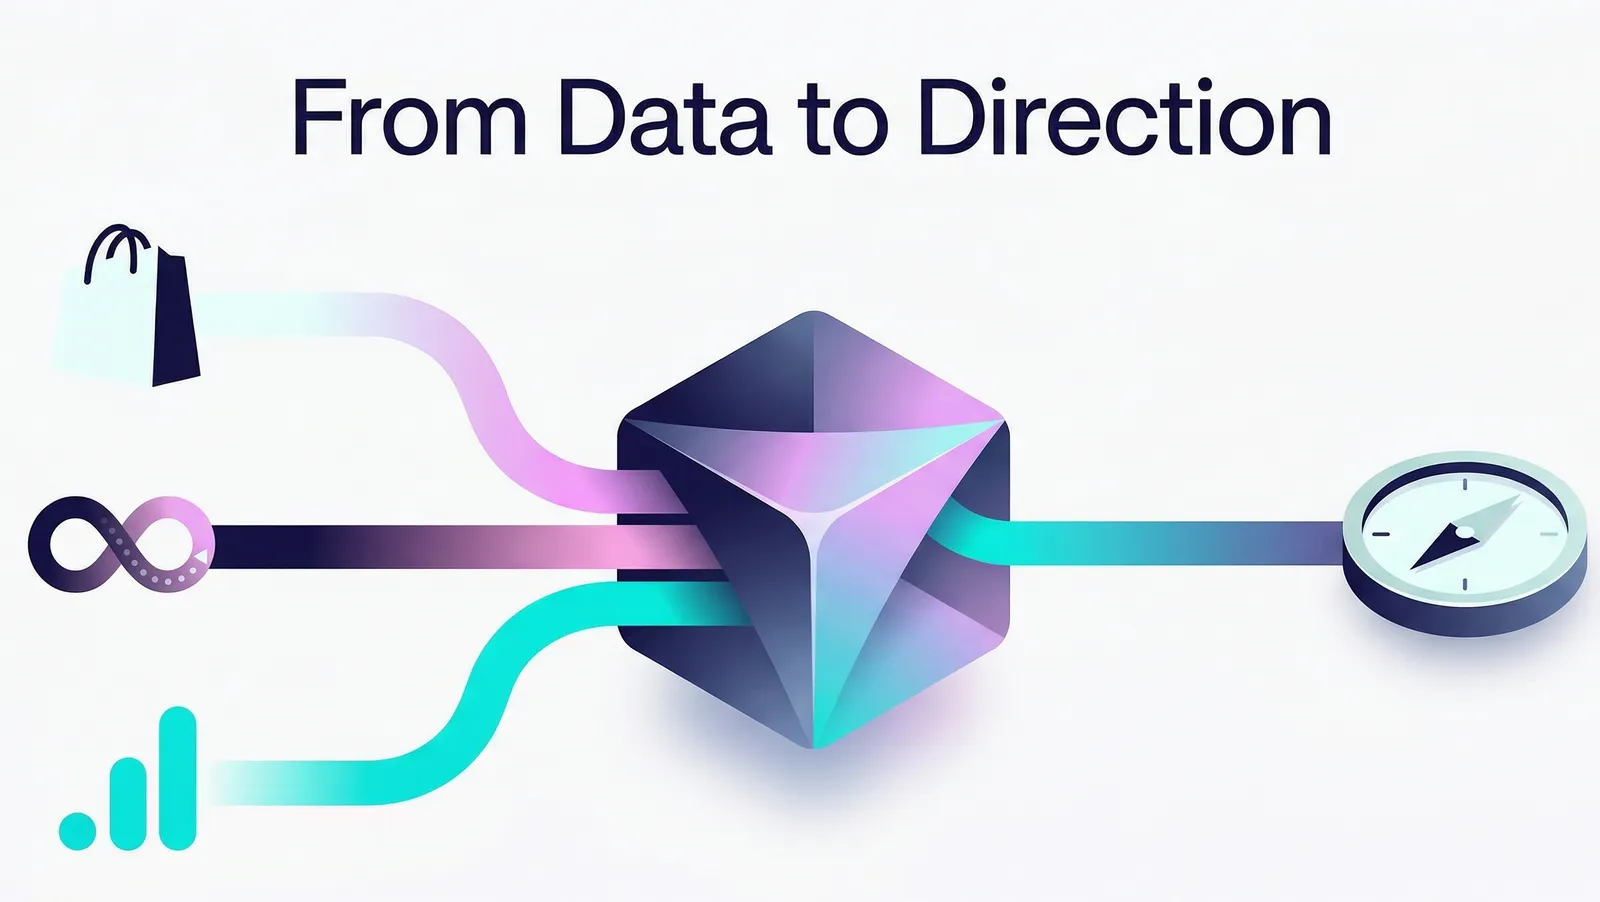
First, automated data pipelines connect directly to Shopify, Google Analytics, advertising platforms, email tools, and inventory systems. Extraction, loading, and transformation run continuously. There are no manual exports, no spreadsheet reconciliation, and no engineering hours spent maintaining fragile workflows.
Second, ecommerce-specific logic is embedded into the system. Margin calculations account for returns and refunds. Inventory velocity adjusts across product categories. Customer lifetime value reflects acquisition channel behaviour. This domain knowledge, which often lives in analyst heads, is built into the platform rather than recreated with each query.
Third, the platform incorporates analytical reasoning. Multi-step analysis that traditionally required analyst expertise — tracing causes across data sources, isolating variables, identifying anomalies, connecting operational changes to business outcomes — happens automatically. Operators receive insight rather than workload.
Three Ways to Interact Based on Use Case
Metrics Cards provide instant visibility into the KPIs operators check daily: revenue, conversion rates, customer acquisition cost, inventory levels, and channel performance.
Data Explorer allows business users to conduct deeper analysis without SQL knowledge. Users select dimensions and metrics based on how they think about the business while the system handles joins and business rules automatically.
“Genie” is the conversational layer. It performs multi-step analysis across your data sources, identifies root causes, traces operational impact, and surfaces insights proactively. It also generates alternative courses of actions based on those insights. As an example, it will identify if you’re not optimising your sell-through and recommend alternative bundling or discounting strategies that will improve inventory turnover while maintaining margins.
How Unified Data Changes Decision-Making
When everyone works from the same data source with consistent definitions, decisions become faster and more coherent. Finance, marketing, operations, and leadership operate from identical metrics rather than separate extracts pulled from different systems.
Analytics becomes part of daily operations rather than a specialised function.
Why This Works Where Other Approaches Don’t
Unlike hiring analysts, the system does not create a queue. Unlike standalone BI platforms, integration and business logic are not separate projects. Unlike automation tools that rely on exported files, this approach maintains live integrations and embedded ecommerce models as continuous infrastructure.
The result is consistent analysis and clear recommendations on what to do next.
Early Results
Customers are saving 10 to 15 hours per week that previously went to manual data pulls and spreadsheet reconciliation.More importantly, teams are answering questions in meetings instead of waiting days for reports.
Making Enterprise-Grade Analytics Accessible
Large ecommerce companies have analytics infrastructure that enables continuous optimisation. Smaller companies historically could not justify the cost and complexity required to replicate it.
Delivering ecommerce analytics as a purpose-built service changes that dynamic. Designed specifically for ecommerce operations and accessible without technical expertise, the same decision capability becomes viable at a different scale.
The infrastructure gap is real and it's solvable. We've built what we believe is the right approach, but the proof is in how ecommerce teams actually use it. If you're curious what that looks like in practice, reach out.
Georges
Key Takeaways
Ecommerce decision-making improves when integration, domain logic, and analytical reasoning operate as a unified system.
Embedded ecommerce-specific logic removes reliance on analyst memory and manual model construction.
Multiple interaction modes support KPI checks, deeper exploration, and automated multi-step reasoning.
Early users are recovering 10–15 hours weekly previously spent on manual data work.
Purpose-built ecommerce analytics makes enterprise-grade decision capability accessible to small and mid-market companies.
·
Frequently Asked Questions
Q: How is this different from using Shopify analytics plus Tableau or Looker?
Traditional tools require you to manage integrations and maintain business logic separately. Here, pipelines, domain logic, and interaction layers operate as a unified system designed specifically for ecommerce operations.
Q: What makes this ecommerce-specific versus general analytics?
The system incorporates pre-built ecommerce logic such as margin calculations with returns, inventory velocity by category, and lifetime value by acquisition channel.
Q: Can I connect Shopify / Magento / WooCommerce / Other, Google Analytics, advertising, and other platforms?
Yes. Direct integrations connect to major ecommerce, marketing platforms, WMS, OMS, finance and other point solutions, as well as custom integrations, with continuous data pipelines.
Q: Can non-technical operators use this without SQL?
Yes. Interfaces are designed around business questions rather than database structure. Technical joins and rules are handled automatically.
Q: How long does implementation take?
Typically, days to a few weeks from connection to operational use depending on if it’s a connection to a standard or custom data source.
Q: Does this replace analysts?
It removes routine analysis and manual preparation work. Analysts remain valuable for strategic judgement and complex scenarios.
Q: What are the limitations?
The platform is built for standard ecommerce operations. Highly customised data models may require additional configuration.
Know where to act next
Agenie connects your stack and turns your metrics into decisions. Live in minutes, no SQL required.
No credit card required · Or book a demo