
A customer buys a £40 top. Returns it. You refund £40.
That's not where the cost ends. That's where it starts.
You also paid to ship it to them. You're now paying to ship it back. Someone inspects it, repackages it, decides if it can be resold. If it can't, you liquidate it at a fraction of what you paid. If it can, it goes back into stock, but it's already cost you time, labour, and warehouse space.
The industry estimate is that processing a return costs around 21% of the original order value. That comes from a Pitney Bowes survey of 168 US online retailers (2022), and while the exact number will vary by product and fulfilment setup, the range most operators cite is 20 to 30% of order value once you factor in reverse shipping, inspection, restocking, and dead stock.
On a £40 item, that's £8 to £12 gone before you even consider the refund. On a £100 order, it's £20 to £30 in pure cost. Your gross margin on that sale doesn't just shrink. It goes negative.
The UK numbers
UK ecommerce has a return rate of roughly 17.5% across all categories. That's higher than the US at 11% and Australia at 10.9%.
For fashion, the picture is worse. The British Fashion Council found that UK online apparel returns average around 30%. Offline fashion returns sit at about 10%. The gap is almost entirely driven by one thing: people can't try clothes on before they buy them online.
This isn't getting better. 46% of online shoppers now bracket their purchases, meaning they buy multiple sizes or colours with the intention of returning most of them. That's up from 33% in 2021, according to ZigZag, which processes returns for major UK retailers.
The scale of this is significant. In January 2026 alone, an estimated £1.55 billion worth of goods bought over the holiday season were returned by UK consumers.
Across the whole market, US retail returns totalled $849.9 billion in 2025 according to the National Retail Federation. That's 15.8% of all sales. For online orders specifically, the return rate is closer to 19.3%.
Why returns happen
The data on why customers return products is more useful than the headline return rate, because it tells you where to focus.
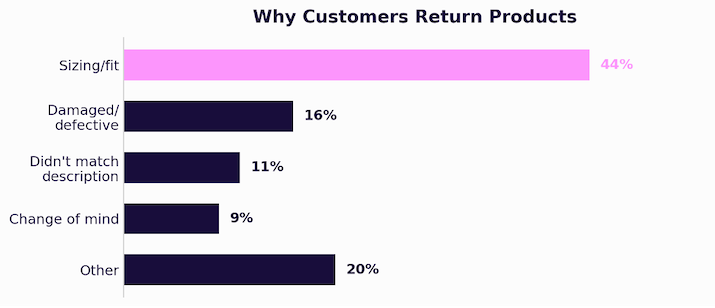
The biggest driver is fit and sizing, accounting for roughly 44% of all returns. This is followed by damaged or defective items at around 16%, items not matching the description at 11%, and change of mind at about 9%.
These numbers shift depending on who's reporting them and what category they're measuring. But the pattern is consistent across every study: fit is the number one reason, and it's not close.
This matters because fit-related returns are the most preventable. A damaged item is a quality control problem. A change of mind is hard to influence. But a customer ordering the wrong size because your size chart doesn't match your actual cuts, or because your product photography doesn't show how the garment drapes on a real body, that's a data and information problem. And it's fixable.
Fraud, wardrobing, and intentional abuse
Not all returns are honest mistakes. A growing category is deliberate abuse: wardrobing (buying an item, wearing it once, returning it), bracket buying taken to extremes, and outright fraud such as returning counterfeit items or claiming non-delivery on orders that were received.
Estimates vary, but the NRF found that 15.14% of all returned merchandise in the US in 2025 was fraudulent. That includes returns of stolen goods, receipt fraud, and wardrobing. On the $849.9 billion in returns, that's $128.7 billion in fraudulent returns alone.
For fashion specifically, wardrobing is the most common form. Social media has made it worse. Customers buy an outfit for a photo, post it, and return it the next day. Some retailers have responded with visible security tags placed in photo-visible locations, or with algorithms that flag accounts showing suspicious patterns (high return rates, returns always within 24 to 48 hours, or items returned with signs of wear).
This is distinct from the sizing problem. Sizing returns are preventable through better information. Wardrobing and fraud require detection and enforcement, which is why ASOS's data-driven tiered system is as much an anti-fraud tool as a returns policy.
What UK retailers are doing about it
The policy lever is already being pulled. 35% of the UK's top 100 fashion retailers now charge customers for returns, whether that's a flat shipping fee deducted from the refund, a per-return charge, or a restocking fee. That's up from 23% in 2023. Not a single retailer that introduced these charges in the past three years has reversed the decision.
ASOS is the most interesting case study here. In January 2026, they launched a transparency tool that shows each customer their personal return rate within the app. The system is tiered:
Customers with a return rate below 70% keep free returns.
Above 70%, a £3.95 return fee kicks in if you keep less than £40 of your order.
Above 80%, an additional £3.95 restocking fee applies on top.
These thresholds are extremely high. A 70% return rate means a customer is sending back seven out of every ten items. ASOS isn't targeting normal shoppers here. They're targeting a tiny fraction of users whose behaviour is commercially unsustainable, including wardrobers: people who buy an outfit, wear it once to an event, and return it the next day with the tags tucked back in. Wardrobing has been a growing problem for online fashion retailers, and ASOS's tiered system is as much an anti-fraud measure as it is a returns policy.
For smaller D2C brands, these thresholds aren't a useful benchmark. Your customer base is smaller, your margins are tighter, and a 70% return rate on even a handful of customers can do real damage. The takeaway from ASOS isn't the specific numbers. It's the principle: use data to identify the behaviour that's actually costing you money, and address it surgically rather than penalising everyone.
But charging for returns is a blunt instrument. 60% of UK shoppers say they'd stop buying from a retailer that charges for returns. For a D2C brand without the market power of ASOS, introducing fees is a risk. You might reduce returns and lose customers at the same time.
The better question is: can you prevent the returns from happening in the first place?
The problem with aggregate data
Most brands know their overall return rate. Very few know their return rate by SKU.
This matters more than it sounds. An overall return rate of 8% looks manageable. But when you break it down, you might find that half your SKUs are at 3% and a handful are at 25% or higher. The average is hiding a concentration problem.
We asked Genie, the AI assistant built into Agenie, to break down return rates for a mid-market apparel brand. Genie connects directly to a brand's Shopify, support, ad, and subscription data, so it can run analyses across systems that would normally require pulling exports from three or four different platforms. Their overall return rate was 8.3%. Not alarming on the surface. But when we broke it down by product category and then by individual SKU, the picture changed completely.
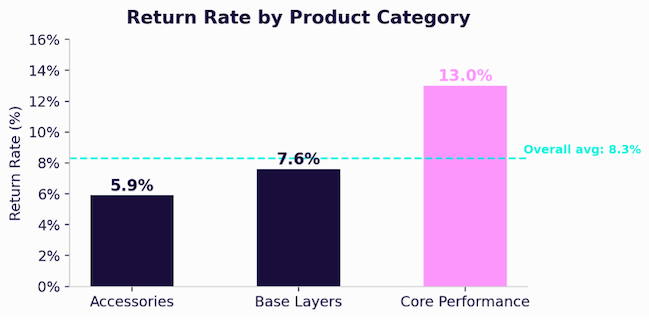
By category, the spread was wide. Their core performance category was running at 13% returns, more than double the rate for accessories at 5.9%. Other product lines sat in the middle at 7.6%.
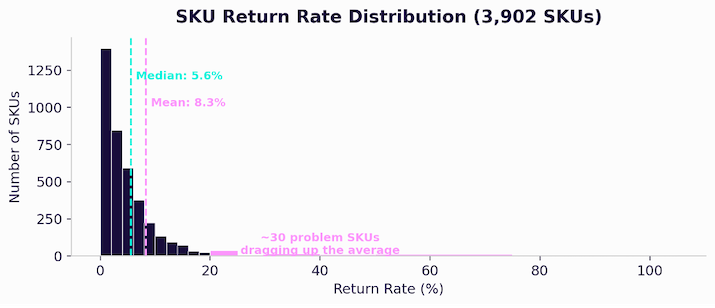
But the real insight was at SKU level. Across 3,902 SKUs, the median return rate was just 5.6%. The 8.3% average was being dragged up by roughly 25 to 30 problem SKUs. Six of those had a 100% return rate. Every unit shipped came back.
That's not an overall returns problem. That's a handful of specific products with something fundamentally wrong, whether it's sizing, labelling, product description, or quality on a specific batch.
What the data actually told us
The next question was obvious: why are these specific products being returned?
The brand didn't have structured return reason data. Shopify doesn't capture that by default. But they did have 19,000 support tickets in Gorgias, a customer support platform that integrates with Shopify and centralises email, chat, and social conversations into one helpdesk.
When we cross-referenced the returns data with support ticket patterns, the picture became clear. Out of 19,000 total tickets, we filtered for return-related conversations. Sizing was the dominant theme. Customers were contacting support to change sizes before shipping, asking for sizing advice before ordering, and requesting exchanges after receiving items. Defect and quality complaints were minimal, under 1% of tickets.
The diagnosis: this was a sizing problem, not a quality problem. The products themselves were fine. The information customers had when making the purchase decision was not.
The 13% return rate on their core category made sense in this light. Their core category had tighter fit tolerances than the rest of the range, which made the sizing problem worse. The margin between 'fits well' and 'going back' was smaller than on their looser-cut products. Without clear guidance on how the garment actually fits on different body types, customers guess. And when they guess wrong, they return.
The signals to watch
Beyond your overall return rate, there are several metrics that act as early warning signals for sizing and fit problems.
Return rate by size variant. If your XL returns at three times the rate of your M, your size chart is wrong at the extremes. Most brands never look at this because they only track returns at product level, not variant level. The fix is often as simple as updating your measurements or adding a 'this size runs small/large' note.
Exchange-to-refund ratio. A high exchange rate is actually a good sign. It means customers want the product, they just got the wrong size. A high refund rate with low exchanges means something else is going on, possibly the product itself isn't meeting expectations. If you're seeing lots of exchange requests that convert to refunds, that's a friction problem in your exchange process.
First-order vs repeat-order return rates. New customers almost always return at higher rates than repeat buyers. That's expected. They're learning your sizing. But if the gap is large, say 25% vs 8%, your product pages aren't giving first-time buyers enough information to get it right.
Pre-purchase sizing questions in support. If customers are contacting you before buying to ask 'will this fit me?', your product page has failed them. Track the volume of these tickets. A spike after a new product launch tells you the sizing guidance on that product needs immediate attention.
Return timing. Returns within the first three days of delivery almost always signal an immediate fit issue. The customer tried it on, it didn't fit, they sent it back. Returns after two to three weeks are more likely quality or expectation issues. The timing tells you the cause.
Holiday and gifting periods. Return rates spike after gifting holidays, and the reason is obvious: the buyer isn't the wearer. They're guessing at someone else's size. If your product pages don't include guidance for gift buyers, such as 'buying for someone else? Here is how to choose the right size', you're leaving money on the table every November and December. Some brands see return rates jump 10 to 15 percentage points during January on items bought as gifts.
What you can actually do
The standard advice on reducing returns is: better size charts, better photography, better product descriptions. All true. All worth doing. But it's generic, and most operators have heard it before.
Here's what's more useful.
Know your SKU-level return rate. Not your overall rate. Your rate by product, by variant, by size. Any SKU running above 15 to 20% deserves a product page audit.
Cross-reference returns data with support data. Returns data tells you what's coming back. Support data tells you why. Most brands have both but never connect them. When you do, you stop guessing and start diagnosing.
Track return rates by acquisition channel. Customers acquired through heavy discounting or aggressive paid social tend to return at higher rates than organic or repeat buyers. If one campaign is driving a 40% return rate, the CAC on that campaign is much worse than your dashboard thinks.
Capture structured return reasons. Shopify doesn't do this by default. If you're processing returns without a mandatory reason field, you're flying blind. A simple dropdown added to your refund process gives you the data you need to act.
Audit your worst performers quarterly. Pull your top 20 returned SKUs every quarter. Look at what they have in common. Is it a size run issue? A specific supplier? A product category where your photography doesn't match reality? The fixes are usually simple once you can see the pattern.
Prepare for gifting seasons. Before November, audit your sizing guidance for gift-friendliness. Add 'buying as a gift?' prompts. Consider including fit cards in packaging during holiday months. The brands that do this see materially lower January return rates.
The infrastructure problem
None of this is exotic. The individual data points exist in most D2C businesses already. Return rates are in Shopify. Support tickets are in your helpdesk. Product data is in your ERP or inventory system. Acquisition channel data is in your ad platforms.
The problem is that they sit in different systems and nobody is connecting them. Your returns data doesn't talk to your support data. Your support data doesn't talk to your product data. And your product data doesn't talk to your acquisition data.
So the operator ends up looking at an overall return rate of 8.3% and thinking things are fine, when six SKUs are at 100% and the answer is sitting in a support ticket from three months ago.
This is what we built Agenie to solve. Not returns specifically, but the underlying problem: your data is spread across your entire D2C stack and nobody is connecting it. When you do connect it, the answers are usually obvious. Which products are bleeding margin. Why. And what to do about it.
What's changed, why, and what to do about it.
Georges
Key Takeaways
1. Returns cost 20 to 30% of order value to process. On most apparel, a return doesn't just wipe the margin. It makes the sale negative.
2. 44% of returns are sizing-related. Sizing is the most preventable return reason. It's a data and information problem, not a product problem.
3. Your overall return rate is hiding a concentration problem. When we broke down one brand's 8.3% average, the median SKU was at 5.6% and six SKUs were at 100%. Fix 25 products and the whole number drops.
4. Connect your returns data to your support data. Returns tell you what's coming back. Support tickets tell you why. Most brands have both and never look at them together.
5. Watch the signals. Return rate by size variant, exchange-to-refund ratio, first-order vs repeat return rates, pre-purchase sizing questions, and return timing. These tell you the cause before the overall number tells you there's a problem.
6. Prepare for gifting seasons. Gift buyers are guessing at someone else's size. If your product pages don't help them, your January return rate will tell you.
Frequently Asked Questions
Q: What's a 'good' return rate for D2C ecommerce?
It depends on category. UK ecommerce overall sits at about 17.5%. Fashion averages 30% online. Non-apparel categories like homeware and electronics tend to run 5 to 15%. But the overall number matters less than the distribution. A 10% average with all SKUs between 8 and 12% is very different from a 10% average where most products are at 4% and three are at 50%.
Q: Should I charge for returns?
It depends on your position in the market. 35% of the UK's top 100 fashion retailers now do, and none have reversed it. But 60% of UK shoppers say they'd stop buying from a retailer that charges. If you have brand loyalty and repeat buyers, a small fee is unlikely to hurt. If you're still acquiring customers and building trust, free returns may be the cost of growth. The better play is reducing returns through better product information rather than passing the cost to customers.
Q: Why doesn't Shopify track return reasons by default?
Shopify's return workflow captures the fact of the return and the financial transaction, but doesn't require structured reason codes. You can add these through apps or by adding a mandatory dropdown to your refund process. Without this, you know what's coming back but not why, which makes prevention almost impossible.
Q: How often should I audit my return data?
At minimum, quarterly. Pull your top 20 returned SKUs, check if the return reasons cluster around a common theme, and cross-reference with support tickets. After a new product launch, check return rates within the first two to four weeks. And before major gifting periods, review your sizing guidance.
Q: What's bracketing and why does it matter?
Bracketing is when a customer deliberately buys multiple sizes or colours, keeps one, and returns the rest. 46% of online shoppers now do this, up from 33% in 2021. It inflates your return rate and your processing costs. Better sizing tools, clearer photography, and fit notes can reduce bracketing by giving customers enough confidence to order one size.
Q: How do returns affect my real CAC?
If a campaign drives 100 orders at £30 CAC but 30 are returned, your effective CAC on the 70 kept orders is £43, not £30. And that's before you add the £8 to £12 processing cost on each return. Most brands calculate CAC on gross orders, not net. If you're not adjusting for returns by channel, you're overvaluing your worst-performing campaigns.
Sources
National Retail Federation / Happy Returns, "2025 Retail Returns Landscape" (2,006 consumers, 358 retail professionals). US retail returns totalled $849.9B in 2025, 15.8% of sales. 15.14% of returns were fraudulent ($128.7B). nrf.com
British Fashion Council / Institute of Positive Fashion, DHL, Roland Berger, "Solving Fashion's Product Returns." UK online apparel returns average ~30%. www.britishfashioncouncil.co.uk
Pitney Bowes BOXpoll (168 US online retailers, Feb 2022). Returns cost retailers ~21% of order value. www.investorrelations.pitneybowes.com
Ingrid, "Charging for Returns? What UK Retail Data Shows in 2026." 35% of UK top 100 fashion retailers now charge for returns. www.ingrid.com
ZigZag Global. 46% of shoppers bracket purchases, up from 33% in 2021. www.zigzag.global
Green Fulfilment, "Returnuary 2026." £1.55B in post-Christmas returns. UK ecommerce return rate ~17.5%. www.greenfulfilment.co.uk
ASOS returns transparency tool (Jan 2026). Tiered fees based on personal return rate. www.retailgazette.co.uk
Agenie platform analysis. Anonymised mid-market apparel brand, SKU-level return rate breakdown across 3,902 SKUs with support ticket cross-reference.
Know where to act next
Agenie connects your stack and turns your metrics into decisions. Live in minutes, no SQL required.
No credit card required · Or book a demo