After we published the DTC Metrics Framework, several people reached out with the same question: "I get the framework. But if I had to pick 5 - 10 metrics to check every week, what would they be?"
It's the right question, asked the wrong way.
The metrics you track should follow your objectives, not the other way around. Starting with a list of numbers is how you end up with 30 charts that nobody looks at after the first week. Starting with the questions your business needs to answer is how you end up with a weekly review that actually changes what you do on Monday morning.
So here are the four questions. The metrics follow.
We reference Shopify, Klaviyo, and Gorgias throughout because most DTC brands we work with run on them. The framework applies equally if you use a different ecommerce platform, email tool, or support system. Swap the data source; the questions stay the same.
How to read this
For each question, we use a simple framework: Watch, Investigate, Act.
Watch the headline number. If it's stable, move on. Investigate when the Watch number moved. These metrics help you find the cause. Act on the specific lever once you've found the problem.
This maps to how DTC metrics actually work. Some metrics are outcomes: you can only observe them. Some are signals: early warnings that tell you to start looking. Some are drivers: levers you can pull today. You watch outcomes. You investigate signals. You act on drivers.
The snapshot
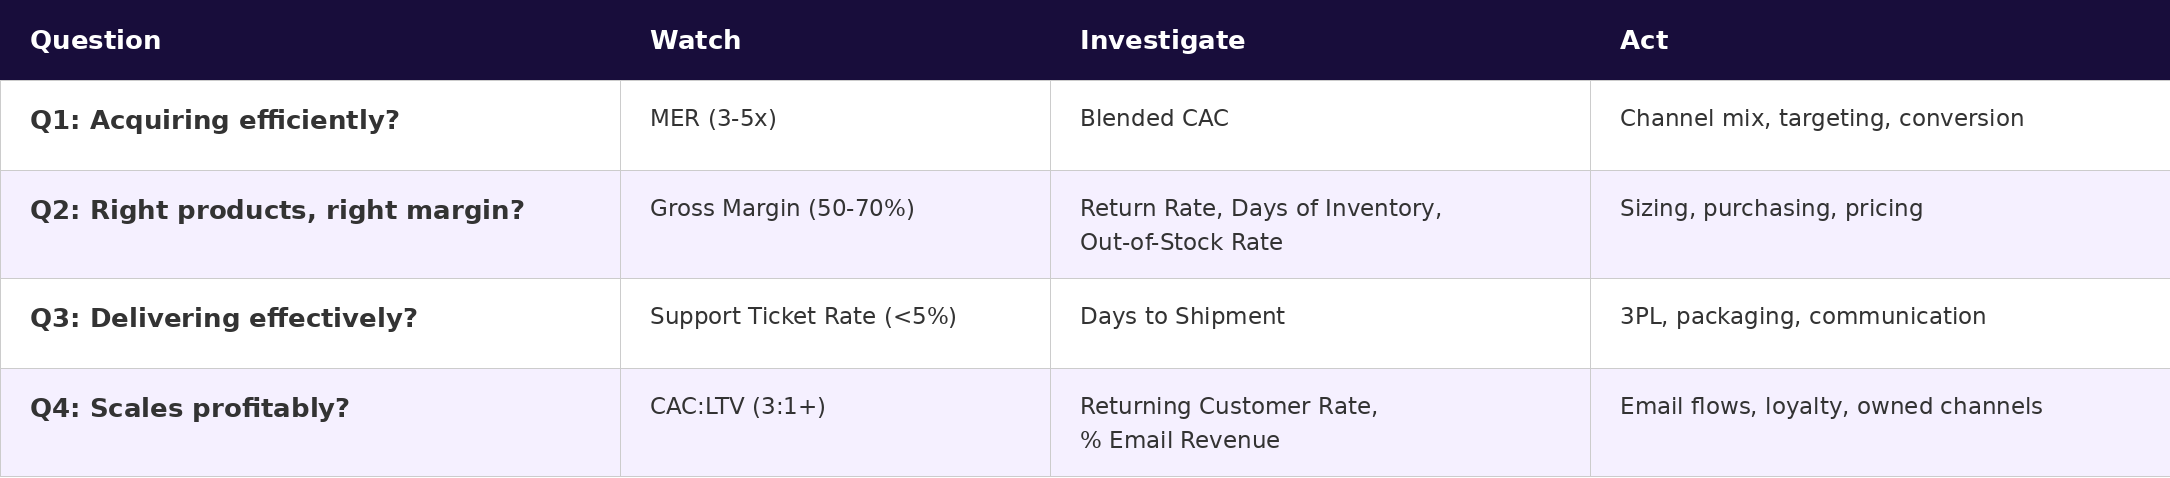
Q1: Am I acquiring customers efficiently?
You spent money on ads this week. Did it work?
Watch: MER (Marketing Efficiency Ratio)
MER is your Shopify net sales divided by your total ad spend across all channels. Also called Blended ROAS.
Shopify Net Sales / (Google Ads Spend + Meta Ads Spend + Other Ad channels)
MER is a signal, not a driver. That distinction matters. Every operator treats MER as their north star, but you cannot pull a "MER lever." When MER moves, it's telling you that something underneath changed. Your job is to find what.
Benchmark: 3x to 5x for healthy DTC brands. Below 3x, your ad spend is outpacing your revenue. Above 5x, you may be under-investing in growth.
Investigate: Blended CAC
Blended CAC is your total ad spend across all channels divided by your Shopify customer count.
(Google Ads Spend + Meta Ads Spend + Other Ad channels) / Shopify Customers
This is a driver. You can move it by shifting budget between channels, tightening targeting, or improving conversion on your landing pages.
Benchmark: DTC apparel £20-60, beauty £15-40, supplements £30-80. The absolute number matters less than the trend and the ratio to lifetime value (Q4).
Diagnostic: If MER dropped and Blended CAC rose, acquisition got more expensive. Check which channel drove the increase. If Blended CAC held steady, the problem isn't acquisition cost. Check AOV or conversion rate.
Act
Shift budget away from the inefficient channel. Tighten targeting. Test new creative. Fix conversion rate on landing pages.
Q2: Am I selling the right products at the right margin?
You acquired the customer. Is what you're selling them actually making money?
Watch: Gross Margin
(Shopify Net Sales - Shopify COGS) / Shopify Net Sales x 100
This is an outcome. You cannot directly pull a gross margin lever. When it moves, you investigate the drivers underneath.
Benchmark: Apparel 50-70%. Beauty 60-80%. Supplements 60-75%. Below 50%, your product economics leave little room for marketing spend.
Investigate: Return Rate, Days of Inventory, Out-of-Stock Rate
Return Rate by SKU
This is a driver. Not the blended average. A healthy 8% overall rate can mask six SKUs at 40%+. Pull the return rate by individual product in Shopify.
Benchmark: Apparel 20-40%. Beauty 5-10%. Supplements under 5%.
Diagnostic: High returns on specific SKUs means a sizing issue, a quality issue, or a misleading listing. Cross-reference with Gorgias support tickets for that SKU. The ticket data often contains the reason.
Days of Inventory
This is a driver. It tells you how many days of sales your current Shopify stock will cover.
Benchmark: Top-performing brands hold around 42 days. The industry median is 129 days. Above 90 days, capital is locked in unsold product.
Diagnostic: High days of inventory means you over-ordered or demand dropped. That stock is tying up cash. Action: clearance bundle, reduce next purchase order, move to a marketplace channel.
Out-of-Stock Rate
This is a driver. The percentage of active Shopify SKUs that can't be purchased right now.
Diagnostic: A bestseller out of stock means every ad click pointing to that page is wasted spend. Expedite the reorder, adjust safety stock, and pause ads for that product immediately.
Act
Fix sizing guides on high-return SKUs. Liquidate slow movers. Reorder fast sellers before they stock out. Cut discounting if margin is eroding through promo dependence.
Q3: Am I delivering effectively?
The customer bought. Now the operational machine needs to work.
Watch: Support Ticket Rate
Gorgias Tickets / Shopify Orders x 100
This is a signal. It tells you something broke, but not what. The spike is the alarm. The ticket categories are the diagnosis.
Benchmark: Below 5% TPO is healthy. Above 8-10% indicates a systemic issue. At £2-5 per ticket, every percentage point above baseline is margin lost to firefighting.
Diagnostic: "Where is my order?" means fulfilment is lagging. "Doesn't fit" or "not as described" means a product issue (cross-reference with Return Rate in Q2). "Damaged in transit" means packaging.
Investigate: Days to Shipment
The average number of days between a Shopify order being placed and shipped. This is a driver. You can directly influence it through 3PL capacity and warehouse operations.
Diagnostic: Days to Shipment going from 2 to 4 days means expect Support Ticket Rate to spike next week. Days to Shipment is the leading indicator. Support Ticket Rate is the lagging confirmation. Catching it here gives you a week's head start.
Act
Escalate with your logistics & fulfillment team / 3PL. Check if order volume exceeded capacity. Identify products causing bottlenecks. Communicate delays proactively if you foresee them before customers create tickets.
Q4: Am I building a business that scales profitably?
This is the question that separates a business from a customer acquisition treadmill. You can acquire efficiently (Q1), sell good products at healthy margins (Q2), and deliver well (Q3). But if customers never come back, you're paying full acquisition cost on every sale, forever.
Watch: CAC:LTV
The ratio of what you paid to acquire a customer to what that customer is worth over time.
Customer Lifetime Value / Blended CAC
This connects back to Q1. Blended CAC is the cost side. LTV is the value side. CAC in isolation is meaningless. £40 CAC is excellent if LTV is £200. It's a death sentence if LTV is £45.
Benchmark: DTC ecommerce typically runs 1.5:1 to 3:1. Subscription brands with strong retention reach 4:1+. Below 1.5:1, each customer is net negative. Above 3:1, your unit economics support scaling.
Investigate: Returning Customer Rate, % Email Revenue
Returning Customer Rate
This is a driver. What percentage of your Shopify customers have bought more than once?
Benchmark: 20-30%+ for healthy DTC. Higher for consumables, lower for durables.
Diagnostic: If fewer customers are coming back, the problem is product quality, post-purchase experience, or competitive alternatives. Check Return Rate in Q2 for the quality signal.
% Email Revenue
This is a driver. What proportion of Shopify orders come through Klaviyo versus paid channels?
Klaviyo Orders / Shopify Orders x 100
Benchmark: 20-30% is healthy. Below 10% means you're paying to re-acquire customers you already own.
Diagnostic: Dropping % Email Revenue means your Klaviyo flows aren't converting, list health is declining, or send cadence is off.
Act
Audit post-purchase email flows in Klaviyo. Fix win-back sequences. Grow the email list through on-site capture. Invest in owned channels that extend LTV without paying acquisition cost again.
Why this framework works
Most DTC reporting is built metrics-first. Conversion rate, then AOV, then revenue, then ROAS, then 15 more numbers. Within a month, 30 charts, and nobody changes their behaviour based on any of them.
This is objectives-first. Four questions. Eleven metrics. Each metric has a job: watch it, investigate with it, or act on it. And the connections between metrics are where the real value sits. Return Rate in Q2 explains why LTV is falling in Q4. Days to Shipment in Q3 predicts the Support Ticket spike next week. MER in Q1 is the alarm; Blended CAC is the diagnosis.
These connections only become visible when you bring data from Shopify, your ad platforms, Klaviyo, and Gorgias into the same view.
We built Agenie to connect data across your D2C stack. What's changed, why, and what to do about it.
Key Takeaways
Don't start with metrics. Start with the questions your business needs to answer. The metrics follow the objectives.
Four questions cover the full DTC operating model: Am I acquiring efficiently? Am I selling the right products at the right margin? Am I delivering effectively? Am I building a business that scales profitably?
Not all metrics are equal. Outcomes (Gross Margin, CAC:LTV) are numbers you watch. Signals (MER, Support Ticket Rate) are early warnings you investigate. Drivers (Blended CAC, Return Rate, Days of Inventory) are levers you act on.
The connections between metrics matter more than the metrics themselves. Return Rate in Q2 explains why LTV is falling in Q4. Days to Shipment in Q3 predicts the Support Ticket spike next week. These connections require data from Shopify, your ad platforms, Klaviyo, and Gorgias in one view.
Frequently Asked Questions
Q: How often should I check these metrics?
The Watch metrics (MER, Gross Margin, Support Ticket Rate, CAC:LTV) weekly. The Investigate and Act metrics when a Watch metric moves. Some operators check MER daily during heavy ad spend periods. Monthly is too infrequent to catch problems before they compound.
Q: What if I don't have all these data sources connected?
Start with what you have. Shopify and your paid ad accounts give you MER, Blended CAC, and Gross Margin. Add Klaviyo for % Email Revenue. Add Gorgias for Support Ticket Rate. Each integration adds a question you can answer.
Q: Where does conversion rate fit?
Conversion rate often shows up as a diagnostic when investigating a drop in MER or rise in Blended CAC. It's an investigation metric, not a Monday morning Watch metric.
Q: What about AOV (Average Order Value)?
AOV is already embedded in other metrics here. Blended CAC relative to AOV tells you whether each order covers its acquisition cost. We excluded it because it's better used as a diagnostic, and Shopify already shows it.
Q: Is this framework only for brands using paid acquisition?
The four questions apply to any DTC brand, but some metrics assume paid ad spend (MER, Blended CAC, CM3). If you acquire primarily through organic or wholesale, replace ad spend metrics with your relevant acquisition costs. The Watch, Investigate, Act structure works regardless.
Q: What's the difference between MER and ROAS?
ROAS as reported by Google Ads or Meta measures revenue each platform claims its ads generated. MER uses your actual Shopify revenue divided by total ad spend across all platforms. When you run multiple platforms, each may claim credit for the same sale. MER eliminates double-counting by using Shopify as the single source of truth. Platform ROAS is useful for campaign-level optimisation. MER is the strategic number.
Sources
Agenie DTC Metrics Map. Signal, Driver, Outcome tier framework for DTC ecommerce metrics.
Finaloop, "Ecommerce Profit Benchmarks: P&L + Performance Metrics." Median days inventory outstanding data. finaloop.com
Foundry CRO, "LTV:CAC Ratio Benchmarks 2026 + Free Calculator." LTV:CAC benchmarks by business model. foundrycro.com
The Good Monster, "Rising Support Tickets Are a Margin Problem." Tickets per order benchmarks and cost analysis. thegoodmonster.com
Yotpo, "2026 Ecommerce Benchmarks: The Efficiency Imperative." CAC trends and DTC benchmarks. yotpo.com
Onramp Funds, "Inventory Turnover Benchmarks by Industry 2025." Turnover ratios by category. onrampfunds.com
Know where to act next
Agenie connects your stack and turns your metrics into decisions. Live in minutes, no SQL required.
No credit card required · Or book a demo